
For the first year of running a SaaS checkout, I treated analytics the way everyone tells you to treat analytics. I looked at a funnel chart. Product viewed, quote viewed, payment started, booking confirmed. Four bars. I squinted at the gaps between them. I had opinions about the gaps. The opinions were almost always wrong.
The funnel told me where shoppers died. It never told me why. “Thirty percent fall off at payment” is not a reason. It is a shape. And the thing I eventually figured out, embarrassingly late, is that a shape is not a thing you can fix. You can only fix a reason.
So I stopped opening the funnel first. Now, every week — usually Sunday morning before anything else is loud — I open PostHog and watch five or six real customer sessions back-to-back, start to finish, with the volume off, like a film director reviewing dailies.
That one habit changed how I ship checkout more than any dashboard ever did.
Dailies
Dailies are what film crews do at the end of a shoot day. The director, the DP, the editor, a few key people sit in a room and watch the raw footage that was shot that day. Not cut. Not scored. Just the takes. They are looking for the thing that will become a problem in two weeks if they do not catch it now — a continuity error, a performance that is not landing, a lens that drifted out of focus on the setup shot. The dailies are not a report. The dailies are the thing.
Funnels tell you where. Replays tell you why.
— Everyone who has ever shipped a checkout
Session replay is dailies for a SaaS checkout. It is the raw footage. Somebody’s cursor hovers over “pay” for eleven seconds. Somebody tabs back to the quote page three times to re-read the price. Somebody picks a time, scrolls down, scrolls back up, picks a different time, backs out. Somebody types their email, mis-types it, deletes the whole field in frustration, and leaves. None of that shows up in a bar chart. All of it shows up in the tape.
What I actually instrumented
The Freebo checkout fires four events, by design. Not twelve. Not forty. Four.
export const CHECKOUT_EVENTS = {
  PRODUCT_VIEWED: 'checkout_product_viewed',
  QUOTE_VIEWED: 'checkout_quote_viewed',
  STARTED: 'checkout_started',
  PAYMENT_FAILED: 'checkout_payment_failed',
} as const;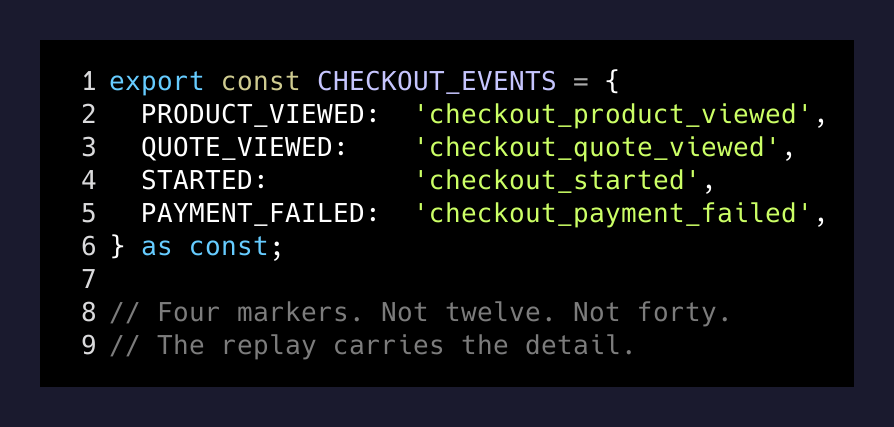
The coarseness is on purpose. I used to want more events. “Price option clicked.” “Date picker opened.” “Promo code field focused.” I would instrument twenty surfaces and then stare at them, and the twenty funnels still would not tell me why a shopper left.
The replay carries the detail. The events are just coordinates — the four moments in a session worth jumping to with the timeline scrubber. Product viewed is “they got in the door.” Quote viewed is “they saw the real price.” Started is “they committed to pay.” Payment failed is “the card broke.” If you have those four markers, you can scrub to the exact second a session turned, and the next thirty seconds of replay is the actual answer.
The Sunday loop
Pull PostHog. Filter to the last seven days. Filter to sessions where checkout_quote_viewed fired but booking_confirmed did not. Sort by duration descending — longer sessions have more signal than someone who bounced in nine seconds. Watch six of them. Not three; three is not enough to notice a pattern. Not twelve; twelve is a workweek. Six.
Here is what came out of a single Sunday after the checkout v2 launch, in rough notes to myself. One shopper opened the quote twice in different tabs — probably comparing. One hovered on the add-ons for twenty-three seconds, then closed them without picking one; the copy was not pulling its weight. One got to the payment form, had the Stripe element not render for about four seconds, and left before it loaded. One typed a promo code that did not exist and did not get a clear enough “this code is not valid” response, and gave up. One brought a friend into the tab (two cursors, two scroll speeds, pure gift) and finished the booking together.
None of those five observations are in a dashboard. All five of them became tickets by Monday morning.
Funnels versus replay, said plainly
| Feature | Funnel chart | Session replay |
|---|---|---|
| Tells you where shoppers die | ✓ | ✓ |
| Tells you why they die | − | ✓ |
| Scales to a million sessions | ✓ | − |
| Catches rendering bugs you forgot about | − | ✓ |
| Shows hesitation | − | ✓ |
| Shows a confused shopper reading your copy | − | ✓ |
| Good at 9am Monday standup slide | ✓ | − |
You need both. The mistake is thinking the funnel is enough.
The funnel is still open in another tab. I am not making an either-or point. The funnel tells me whether this week was better than last week, which is the number that matters when I am tempted to confuse motion for progress. The replay tells me what to actually ship next.
The directorial frame
Here is the deeper thing that I think gets missed. When a founder watches a funnel, the shopper is a number. When a founder watches a replay, the shopper is a person trying to buy from you, right now, with their actual hand, on their actual phone, in their actual lunch break. That change in frame is the whole thing.
A director’s job on set is not to read a continuity report at the end of the day. It is to watch what the camera actually captured and ask whether it is any good. If you are the founder of a product people pay money for, your job is not to read the funnel chart. It is to watch what your product actually looked like for the people trying to pay you, and ask whether it was any good.
Six sessions. A cup of coffee. One hour on a Sunday. That is the whole practice.
The surprise is how often the answer to “why are we not converting” is sitting right there in the second minute of the third replay you watch. You just have to be the person who presses play.